 Web Server Statistics for NIC.Funet.fi Web Server Statistics for NIC.Funet.fi
(Go To: Top: General Summary: Monthly Report: Daily Summary: Hourly Summary: Domain Report: Organisation Report: Status Code Report: File Size Report: File Type Report: Directory Report: Request Report)
This report contains overall statistics.
Successful requests: 134
Average successful requests per day: 19
Distinct files requested: 52
Distinct hosts served: 61
Data transferred: 291.09 megabytes
Average data transferred per day: 43.19 megabytes
(Go To: Top: General Summary: Monthly Report: Daily Summary: Hourly Summary: Domain Report: Organisation Report: Status Code Report: File Size Report: File Type Report: Directory Report: Request Report)
This report lists the activity in each month.
Each unit ( ) represents 15 megabytes
or part thereof.
) represents 15 megabytes
or part thereof.
   month: Mbytes: %bytes: reqs:  %reqs:
--------: ------: ------: ----: ------:
Dec 2003: 291.09:   100%:  134:   100%:
Busiest month: Dec 2003 (291.09 megabytes).
(Go To: Top: General Summary: Monthly Report: Daily Summary: Hourly Summary: Domain Report: Organisation Report: Status Code Report: File Size Report: File Type Report: Directory Report: Request Report)
This report lists the total activity for each day of the week, summed over all the weeks in the report.
Each unit () represents 4 megabytes
or part thereof.
day: Mbytes: %bytes: reqs: %reqs: ---: ------: ------: ----: ------: Sun: 53.48: 18.37%: 32: 23.88%:Mon: 18.81: 6.46%: 10: 7.46%:

(Go To: Top: General Summary: Monthly Report: Daily Summary: Hourly Summary: Domain Report: Organisation Report: Status Code Report: File Size Report: File Type Report: Directory Report: Request Report)
This report lists the total activity for each hour of the day, summed over all the days in the report.
Each unit () represents 1 request
for a page.
hour: Mbytes: %bytes: reqs:  %reqs:
----: ------: ------: ----: ------:
   0:   0.02:  0.01%:    1:  0.75%:
   1:   3.26:  1.12%:    2:  1.49%:
   2:   0.17:  0.06%:    2:  1.49%:
   3:  18.35:  6.30%:    3:  2.24%:
   4:   0.26:  0.09%:    2:  1.49%:
   5:  42.71: 14.67%:    8:  5.97%:
   6:   4.39:  1.51%:    2:  1.49%:
   7:   0.00:       :    0:       :
   8:   0.00:       :    0:       :
   9:  34.58: 11.88%:    2:  1.49%:
  10:   0.06:  0.02%:    2:  1.49%:
  11:   3.73:  1.28%:    3:  2.24%:
  12:   0.03:  0.01%:    2:  1.49%:
  13:   9.02:  3.10%:    7:  5.22%:
  14:   9.39:  3.23%:   10:  7.46%:
  15:   9.79:  3.36%:    3:  2.24%:
  16:  18.95:  6.51%:    6:  4.48%:
  17:   0.21:  0.07%:    4:  2.99%:
  18:  12.15:  4.18%:   21: 15.67%:
  19:  45.12: 15.50%:   20: 14.93%:
  20:  31.97: 10.98%:   18: 13.43%:
  21:  18.53:  6.37%:    7:  5.22%:
  22:  13.98:  4.80%:    2:  1.49%:
  23:  14.41:  4.95%:    7:  5.22%:
(Go To: Top: General Summary: Monthly Report: Daily Summary: Hourly Summary: Domain Report: Organisation Report: Status Code Report: File Size Report: File Type Report: Directory Report: Request Report)
This report lists the countries of the computers which requested files.

Listing domains, sorted by the amount of traffic.
Mbytes: %bytes: reqs:  %reqs: domain
------: ------: ----: ------: ------
112.32: 38.59%:   36: 26.87%: [unknown domain]
 43.84: 15.06%:   22: 16.42%: .fi (Finland)
 22.70:  7.80%:    4:  2.99%:   voas.fi
 20.01:  6.87%:    3:  2.24%:   saunalahti.fi
 40.01: 13.74%:   28: 20.90%: .net (Networks)
 15.27:  5.25%:   13:  9.70%:   kyuu.net
 14.64:  5.03%:    7:  5.22%:   fastres.net
  6.12:  2.10%:    2:  1.49%:   att.net
  2.79:  0.96%:    1:  0.75%:   chartermi.net
 27.03:  9.29%:    8:  5.97%: .fr (France)
 24.41:  8.39%:    4:  2.99%: .hu (Hungary)
 14.26:  4.90%:    2:  1.49%: .org (Non Profit Making Organisations)
 14.26:  4.90%:    2:  1.49%:   katiska.org
 10.04:  3.45%:    9:  6.72%: .com (Commercial)
  5.05:  1.73%:    2:  1.49%:   exatt.com
  2.69:  0.92%:    1:  0.75%:   skanova.com
  2.30:  0.79%:    6:  4.48%:   aol.com
  6.62:  2.27%:    1:  0.75%: .it (Italy)
  5.11:  1.76%:    7:  5.22%: .es (Spain)
  3.15:  1.08%:    1:  0.75%: .ca (Canada)
  1.75:  0.60%:    4:  2.99%: .cl (Chile)
  1.75:  0.60%:    3:  2.24%: .ar (Argentina)
  0.43:  0.15%:    1:  0.75%: .ru (Russia)
  0.35:  0.12%:    3:  2.24%: .br (Brazil)
  0.02:  0.01%:    1:  0.75%: .ch (Switzerland)
  0.00:       :    2:  1.49%: .mx (Mexico)
  0.00:       :    1:  0.75%: .pl (Poland)
  0.00:       :    1:  0.75%: .pt (Portugal)
(Go To: Top: General Summary: Monthly Report: Daily Summary: Hourly Summary: Domain Report: Organisation Report: Status Code Report: File Size Report: File Type Report: Directory Report: Request Report)
This report lists the organisations of the computers which requested files.
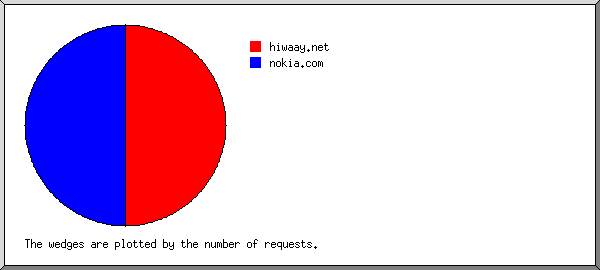
Listing the top 20 organisations by the number of requests, sorted by the number of requests.
reqs: %bytes: organisation
----: ------: ------------
  36: 38.59%: [unknown domain]
  13:  5.25%: kyuu.net
  13:       : helsinki.fi
   7:  5.03%: fastres.net
   7:  1.76%: uni2.es
   6:  9.28%: noos.fr
   6:  0.79%: aol.com
   4:  0.60%: utfsm.cl
   4:  7.80%: voas.fi
   3:  0.03%: telefonica-data.net
   3:  6.87%: saunalahti.fi
   2:  0.01%: club-internet.fr
   2:       : prodigy.net.mx
   2:  2.10%: att.net
   2:  1.73%: exatt.com
   2:  4.90%: katiska.org
   1:  0.02%: telemar.net.br
   1:  0.15%: sovintel.ru
   1:  1.08%: sympatico.ca
   1:       : telepac.pt
  18: 14.02%: [not listed: 18 organisations]
(Go To: Top: General Summary: Monthly Report: Daily Summary: Hourly Summary: Domain Report: Organisation Report: Status Code Report: File Size Report: File Type Report: Directory Report: Request Report)
This report lists the HTTP status codes of all requests.
Listing status codes, sorted numerically.
reqs: status code
----: -----------
 134: 200 OK
(Go To: Top: General Summary: Monthly Report: Daily Summary: Hourly Summary: Domain Report: Organisation Report: Status Code Report: File Size Report: File Type Report: Directory Report: Request Report)
This report lists the sizes of files.

       size: reqs: %bytes:
-----------: ----: ------:
          0:   14:       :
   1B-  10B:    0:       :
  11B- 100B:   12:       :
 101B-  1kB:    3:       :
  1kB- 10kB:    6:       :
 10kB-100kB:   25:  0.29%:
100kB-  1MB:   32:  4.25%:
  1MB- 10MB:   34: 50.57%:
 10MB-100MB:    8: 44.89%:
(Go To: Top: General Summary: Monthly Report: Daily Summary: Hourly Summary: Domain Report: Organisation Report: Status Code Report: File Size Report: File Type Report: Directory Report: Request Report)
This report lists the extensions of files.

Listing extensions with at least 0.1% of the traffic, sorted by the amount of traffic.
Mbytes: %bytes: reqs:  %reqs: extension
------: ------: ----: ------: ---------
227.48: 78.15%:   90: 67.16%: .exe
 41.19: 14.15%:    9:  6.72%: .xpi
 12.76:  4.38%:    3:  2.24%: .zip
  9.64:  3.31%:    6:  4.48%: .gz
  0.01:       :   26: 19.40%: [not listed: 7 extensions]
(Go To: Top: General Summary: Monthly Report: Daily Summary: Hourly Summary: Domain Report: Organisation Report: Status Code Report: File Size Report: File Type Report: Directory Report: Request Report)
This report lists the directories from which files were requested. (The figures for each directory include all of its subdirectories.)
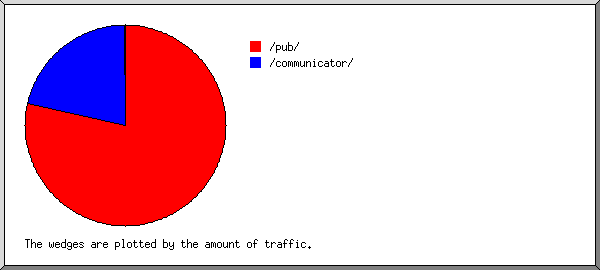
Listing directories with at least 0.01% of the traffic, sorted by the amount of traffic.
Mbytes: %bytes: reqs:  %reqs: pages: %pages: directory
------: ------: ----: ------: -----: ------: ---------
275.81: 94.75%:  107: 79.85%:     0:       : /pub/
 15.28:  5.25%:   22: 16.42%:     0:       : /communicator/
  0.00:       :    5:  3.73%:     0:       : [not listed: 2 directories]
(Go To: Top: General Summary: Monthly Report: Daily Summary: Hourly Summary: Domain Report: Organisation Report: Status Code Report: File Size Report: File Type Report: Directory Report: Request Report)
This report lists the files on the site.
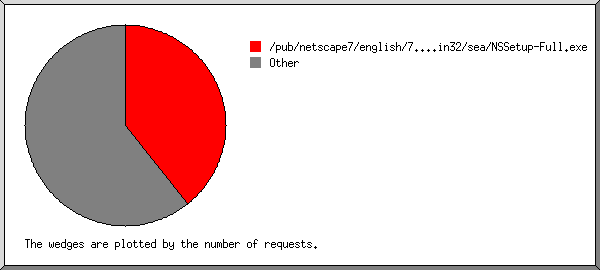
Listing files with at least 20 requests, sorted by the number of requests.
Mbytes: %bytes: reqs:  %reqs: file
------: ------: ----: ------: ----
 25.26:  8.68%:   21: 15.67%: /pub/communicator/spanish/4.78/windows/windows95_or_nt/complete_install/cc32d478.exe
265.83: 91.32%:  113: 84.33%: [not listed: 51 files]
(Go To: Top: General Summary: Monthly Report: Daily Summary: Hourly Summary: Domain Report: Organisation Report: Status Code Report: File Size Report: File Type Report: Directory Report: Request Report)

