 Web Server Statistics for NIC.Funet.fi Web Server Statistics for NIC.Funet.fi
(Go To: Top: General Summary: Monthly Report: Daily Summary: Hourly Summary: Domain Report: Organisation Report: Status Code Report: File Size Report: File Type Report: Directory Report: Request Report)
This report contains overall statistics.
Successful requests: 208
Average successful requests per day: 30
Distinct files requested: 77
Distinct hosts served: 100
Corrupt logfile lines: 2
Data transferred: 782.850 megabytes
Average data transferred per day: 115.502 megabytes
(Go To: Top: General Summary: Monthly Report: Daily Summary: Hourly Summary: Domain Report: Organisation Report: Status Code Report: File Size Report: File Type Report: Directory Report: Request Report)
This report lists the activity in each month.
Each unit ( ) represents 40 megabytes
or part thereof.
) represents 40 megabytes
or part thereof.
   month:  Mbytes: %bytes: reqs:  %reqs:
--------: -------: ------: ----: ------:
Sep 2003: 782.850:   100%:  208:   100%:
Busiest month: Sep 2003 (782.850 megabytes).
(Go To: Top: General Summary: Monthly Report: Daily Summary: Hourly Summary: Domain Report: Organisation Report: Status Code Report: File Size Report: File Type Report: Directory Report: Request Report)
This report lists the total activity for each day of the week, summed over all the weeks in the report.
Each unit () represents 6 megabytes
or part thereof.
day: Mbytes: %bytes: reqs: %reqs: ---: -------: ------: ----: ------: Sun: 157.273: 20.09%: 26: 12.50%:Fri: 147.095: 18.79%: 37: 17.79%:

(Go To: Top: General Summary: Monthly Report: Daily Summary: Hourly Summary: Domain Report: Organisation Report: Status Code Report: File Size Report: File Type Report: Directory Report: Request Report)
This report lists the total activity for each hour of the day, summed over all the days in the report.
Each unit () represents 1 request
for a page.
hour:  Mbytes: %bytes: reqs:  %reqs:
----: -------: ------: ----: ------:
   0:  16.727:  2.14%:    2:  0.96%:
   1:  16.000:  2.04%:    4:  1.92%:
   2:   2.726:  0.35%:    1:  0.48%:
   3:  16.712:  2.13%:    1:  0.48%:
   4:   5.860:  0.75%:    2:  0.96%:
   5:   0.132:  0.02%:    2:  0.96%:
   6:   0.015:       :    1:  0.48%:
   7:  17.131:  2.19%:    9:  4.33%:
   8:   3.919:  0.50%:    6:  2.88%:
   9:  24.113:  3.08%:    9:  4.33%:
  10:  54.048:  6.90%:    5:  2.40%:
  11:   4.551:  0.58%:   14:  6.73%:
  12:  19.516:  2.49%:   21: 10.10%:
  13:  31.957:  4.08%:    6:  2.88%:
  14:  18.507:  2.36%:    7:  3.37%:
  15:  22.841:  2.92%:    5:  2.40%:
  16:  16.467:  2.10%:    5:  2.40%:
  17:  30.592:  3.91%:   15:  7.21%:
  18: 149.329: 19.08%:   17:  8.17%:
  19:  78.499: 10.03%:   22: 10.58%:
  20:  13.343:  1.70%:   11:  5.29%:
  21: 161.110: 20.58%:   15:  7.21%:
  22:  63.621:  8.13%:   16:  7.69%:
  23:  15.122:  1.93%:   12:  5.77%:
(Go To: Top: General Summary: Monthly Report: Daily Summary: Hourly Summary: Domain Report: Organisation Report: Status Code Report: File Size Report: File Type Report: Directory Report: Request Report)
This report lists the countries of the computers which requested files.

Listing domains, sorted by the amount of traffic.
 Mbytes: %bytes: reqs:  %reqs: domain
-------: ------: ----: ------: ------
413.203: 52.78%:   57: 27.40%: .fi (Finland)
240.648: 30.74%:    8:  3.85%:   tpo.fi
 31.842:  4.07%:   16:  7.69%:   hut.fi
 29.286:  3.74%:   10:  4.81%:   soneraliving.fi
 29.270:  3.74%:    1:  0.48%:   netsonic.fi
 26.137:  3.34%:    2:  0.96%:   omakaista.fi
 21.282:  2.72%:    2:  0.96%:   lut.fi
 17.416:  2.22%:    9:  4.33%:   htv.fi
 17.318:  2.21%:    2:  0.96%:   sonera.fi
 92.360: 11.80%:   17:  8.17%: .com (Commercial)
 33.424:  4.27%:    2:  0.96%:   coltfrance.com
 29.270:  3.74%:    1:  0.48%:   rogers.com
 24.674:  3.15%:    2:  0.96%:   comptel.com
  4.546:  0.58%:    1:  0.48%:   aol.com
 65.987:  8.43%:   21: 10.10%: .net (Networks)
 17.207:  2.20%:    2:  0.96%:   piekary.net
 12.428:  1.59%:    1:  0.48%:   wm.net
  9.759:  1.25%:    3:  1.44%:   gw0.net
  7.034:  0.90%:    2:  0.96%:   uu.net
  6.875:  0.88%:    1:  0.48%:   t-dialin.net
  4.718:  0.60%:    1:  0.48%:   iplannetworks.net
 40.813:  5.21%:   33: 15.87%: [unknown domain]
 33.082:  4.23%:    7:  3.37%: .se (Sweden)
 29.270:  3.74%:    1:  0.48%:   uu.se
 24.914:  3.18%:    9:  4.33%: .br (Brazil)
 17.961:  2.29%:    2:  0.96%: .ee (Estonia)
 16.308:  2.08%:    7:  3.37%: .mx (Mexico)
 15.359:  1.96%:    2:  0.96%: .lt (Lithuania)
  9.687:  1.24%:    2:  0.96%: .ch (Switzerland)
  8.921:  1.14%:   10:  4.81%: .hu (Hungary)
  7.064:  0.90%:    1:  0.48%: .eg (Egypt)
  6.201:  0.79%:    3:  1.44%: .fr (France)
  5.406:  0.69%:    1:  0.48%: .uk (United Kingdom)
  4.132:  0.53%:    2:  0.96%: .ph (Philippines)
  3.775:  0.48%:    2:  0.96%: .ar (Argentina)
  3.680:  0.47%:    1:  0.48%: .tr (Turkey)
  3.521:  0.45%:    1:  0.48%: .jp (Japan)
  3.445:  0.44%:    1:  0.48%: .au (Australia)
  2.946:  0.38%:    7:  3.37%: .it (Italy)
  2.617:  0.33%:    5:  2.40%: .sa (Saudi Arabia)
  1.210:  0.15%:    1:  0.48%: .co (Colombia)
  0.122:  0.02%:    1:  0.48%: .de (Germany)
  0.070:  0.01%:    1:  0.48%: .id (Indonesia)
  0.054:  0.01%:    1:  0.48%: .th (Thailand)
  0.000:       :   12:  5.77%: .pl (Poland)
  0.000:       :    1:  0.48%: .ro (Romania)
(Go To: Top: General Summary: Monthly Report: Daily Summary: Hourly Summary: Domain Report: Organisation Report: Status Code Report: File Size Report: File Type Report: Directory Report: Request Report)
This report lists the organisations of the computers which requested files.
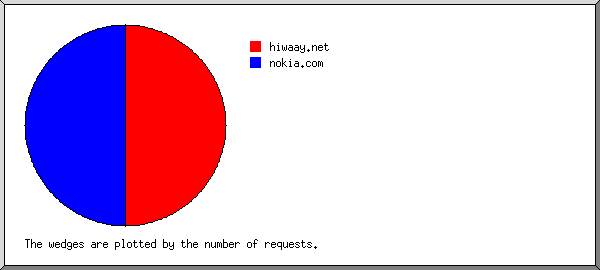
Listing the top 20 organisations by the number of requests, sorted by the number of requests.
reqs: %bytes: organisation
----: ------: ------------
  33:  5.21%: [unknown domain]
  16:  4.07%: hut.fi
  12:       : porta-complex.com.pl
  10:  3.74%: soneraliving.fi
   9:  2.22%: htv.fi
   8:  0.03%: ntl.com
   8: 30.74%: tpo.fi
   5:  0.33%: saudi.net.sa
   5:  0.38%: axelero.hu
   5:  0.76%: freestart.hu
   4:  0.06%: lansankallionkuja.net
   4:  1.78%: brasiltelecom.net.br
   4:  0.04%: dial.net.mx
   4:       : jyu.fi
   4:       : noicomnet.it
   3:  1.25%: gw0.net
   3:  2.04%: iie.org.mx
   3:       : swipnet.se
   2:  3.15%: comptel.com
   2:  2.20%: piekary.net
  64: 41.98%: [not listed: 49 organisations]
(Go To: Top: General Summary: Monthly Report: Daily Summary: Hourly Summary: Domain Report: Organisation Report: Status Code Report: File Size Report: File Type Report: Directory Report: Request Report)
This report lists the HTTP status codes of all requests.
Listing status codes, sorted numerically.
reqs: status code
----: -----------
 208: 200 OK
(Go To: Top: General Summary: Monthly Report: Daily Summary: Hourly Summary: Domain Report: Organisation Report: Status Code Report: File Size Report: File Type Report: Directory Report: Request Report)
This report lists the sizes of files.

       size: reqs: %bytes:
-----------: ----: ------:
          0:   40:       :
   1b-  10b:    1:       :
  11b- 100b:    4:       :
 101b-  1kb:   10:       :
  1kb- 10kb:   12:  0.01%:
 10kb-100kb:   39:  0.23%:
100kb-  1Mb:   25:  0.83%:
  1Mb- 10Mb:   55: 30.59%:
 10Mb-100Mb:   22: 68.34%:
(Go To: Top: General Summary: Monthly Report: Daily Summary: Hourly Summary: Domain Report: Organisation Report: Status Code Report: File Size Report: File Type Report: Directory Report: Request Report)
This report lists the extensions of requested files.

Listing extensions with at least 0.1% of the traffic, sorted by the amount of traffic.
 Mbytes: %bytes: reqs:  %reqs: extension
-------: ------: ----: ------: ---------
573.095: 73.21%:  148: 71.15%: .exe  [Executables]
208.533: 26.64%:   16:  7.69%: .gz   [Gzip compressed files]
208.533: 26.64%:   16:  7.69%:   .tar.gz [Compressed archives]
  1.141:  0.15%:    3:  1.44%: .xpi
  0.079:  0.01%:   41: 19.71%: [not listed: 5 extensions]
(Go To: Top: General Summary: Monthly Report: Daily Summary: Hourly Summary: Domain Report: Organisation Report: Status Code Report: File Size Report: File Type Report: Directory Report: Request Report)
This report lists the directories from which files were requested. (The figures for each directory include all of its subdirectories.)
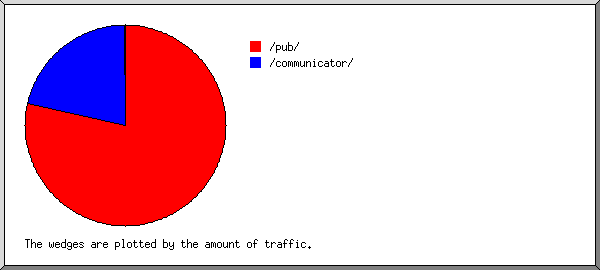
Listing directories with at least 0.01% of the traffic, sorted by the amount of traffic.
 Mbytes: %bytes: reqs:  %reqs: pages: %pages: directory
-------: ------: ----: ------: -----: ------: ---------
648.205: 82.80%:  184: 88.46%:     0:       : /pub/
134.621: 17.20%:   13:  6.25%:     0:       : /communicator/
  0.023:       :   11:  5.29%:     0:       : [not listed: 2 directories]
(Go To: Top: General Summary: Monthly Report: Daily Summary: Hourly Summary: Domain Report: Organisation Report: Status Code Report: File Size Report: File Type Report: Directory Report: Request Report)
This report lists the files on the site.
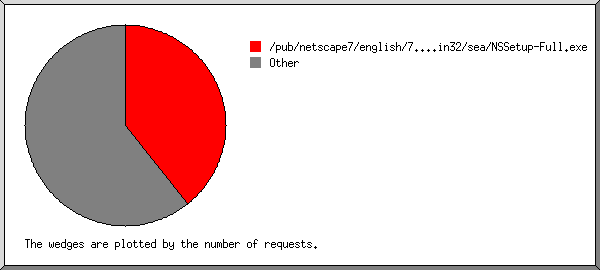
Listing files with at least 20 requests, sorted by the number of requests.
 Mbytes: %bytes: reqs:  %reqs: file
-------: ------: ----: ------: ----
205.891: 26.30%:   32: 15.38%: /pub/netscape7/english/7.1/windows/win32/sea/NSSetup-Full.exe
576.959: 73.70%:  176: 84.62%: [not listed: 76 files]
(Go To: Top: General Summary: Monthly Report: Daily Summary: Hourly Summary: Domain Report: Organisation Report: Status Code Report: File Size Report: File Type Report: Directory Report: Request Report)

