 Web Server Statistics for NIC.Funet.fi Web Server Statistics for NIC.Funet.fi
(Go To: Top: General Summary: Monthly Report: Daily Summary: Hourly Summary: Domain Report: Organisation Report: Status Code Report: File Size Report: File Type Report: Directory Report: Request Report)
This report contains overall statistics.
Successful requests: 198
Average successful requests per day: 28
Distinct files requested: 63
Distinct hosts served: 112
Data transferred: 628.290 megabytes
Average data transferred per day: 91.231 megabytes
(Go To: Top: General Summary: Monthly Report: Daily Summary: Hourly Summary: Domain Report: Organisation Report: Status Code Report: File Size Report: File Type Report: Directory Report: Request Report)
This report lists the activity in each month.
Each unit ( ) represents 30 megabytes
or part thereof.
) represents 30 megabytes
or part thereof.
   month:  Mbytes: %bytes: reqs:  %reqs:
--------: -------: ------: ----: ------:
Aug 2003: 628.290:   100%:  198:   100%:
Busiest month: Aug 2003 (628.290 megabytes).
(Go To: Top: General Summary: Monthly Report: Daily Summary: Hourly Summary: Domain Report: Organisation Report: Status Code Report: File Size Report: File Type Report: Directory Report: Request Report)
This report lists the total activity for each day of the week, summed over all the weeks in the report.
Each unit () represents 5 megabytes
or part thereof.
day: Mbytes: %bytes: reqs: %reqs: ---: -------: ------: ----: ------: Sun: 94.381: 15.02%: 35: 17.68%:Sat: 31.929: 5.08%: 20: 10.10%:
(Go To: Top: General Summary: Monthly Report: Daily Summary: Hourly Summary: Domain Report: Organisation Report: Status Code Report: File Size Report: File Type Report: Directory Report: Request Report)
This report lists the total activity for each hour of the day, summed over all the days in the report.
Each unit () represents 1 request
for a page.
hour:  Mbytes: %bytes: reqs:  %reqs:
----: -------: ------: ----: ------:
   0:   8.281:  1.32%:    1:  0.51%:
   1:  22.925:  3.65%:   12:  6.06%:
   2:  12.973:  2.06%:    6:  3.03%:
   3:   2.960:  0.47%:    5:  2.53%:
   4:   2.932:  0.47%:    3:  1.52%:
   5:   5.339:  0.85%:    2:  1.01%:
   6:   9.832:  1.56%:    3:  1.52%:
   7:   8.781:  1.40%:    4:  2.02%:
   8:  32.731:  5.21%:    2:  1.01%:
   9:   4.984:  0.79%:    4:  2.02%:
  10:  16.849:  2.68%:    3:  1.52%:
  11:  34.261:  5.45%:    4:  2.02%:
  12:  16.014:  2.55%:    8:  4.04%:
  13:  22.881:  3.64%:    9:  4.55%:
  14:  16.476:  2.62%:    5:  2.53%:
  15:  31.816:  5.06%:    8:  4.04%:
  16:  31.801:  5.06%:   16:  8.08%:
  17:  29.796:  4.74%:    9:  4.55%:
  18:  23.461:  3.73%:   13:  6.57%:
  19: 111.755: 17.79%:   36: 18.18%:
  20:  31.180:  4.96%:   15:  7.58%:
  21:  60.166:  9.58%:   11:  5.56%:
  22:  56.902:  9.06%:    9:  4.55%:
  23:  33.184:  5.28%:   10:  5.05%:
(Go To: Top: General Summary: Monthly Report: Daily Summary: Hourly Summary: Domain Report: Organisation Report: Status Code Report: File Size Report: File Type Report: Directory Report: Request Report)
This report lists the countries of the computers which requested files.

Listing domains, sorted by the amount of traffic.
 Mbytes: %bytes: reqs:  %reqs: domain
-------: ------: ----: ------: ------
259.807: 41.35%:   46: 23.23%: .fi (Finland)
 39.177:  6.24%:    2:  1.01%:   tut.fi
 38.946:  6.20%:    4:  2.02%:   tpo.fi
 35.963:  5.72%:    4:  2.02%:   inet.fi
 33.767:  5.37%:    9:  4.55%:   netsonic.fi
 31.927:  5.08%:    4:  2.02%:   multi.fi
 29.270:  4.66%:    1:  0.51%:   kyamk.fi
 16.430:  2.62%:    1:  0.51%:   htv.fi
 12.611:  2.01%:   10:  5.05%:   omakaista.fi
 11.617:  1.85%:    3:  1.52%:   surfeu.fi
  9.581:  1.52%:    1:  0.51%:   kolumbus.fi
126.945: 20.20%:   57: 28.79%: .com (Commercial)
 76.801: 12.22%:   32: 16.16%:   scanditron.com
 17.805:  2.83%:    3:  1.52%:   skanova.com
 16.331:  2.60%:   10:  5.05%:   aol.com
  5.769:  0.92%:    1:  0.51%:   metropolis-inter.com
  4.851:  0.77%:    1:  0.51%:   hknet.com
  4.834:  0.77%:    1:  0.51%:   attbi.com
 65.474: 10.42%:   23: 11.62%: .br (Brazil)
 47.267:  7.52%:   10:  5.05%: .fr (France)
 39.773:  6.33%:    6:  3.03%: .se (Sweden)
 15.828:  2.52%:    4:  2.02%:   bonet.se
 15.664:  2.49%:    1:  0.51%:   kth.se
  8.281:  1.32%:    1:  0.51%:   bredbandsbolaget.se
 35.988:  5.73%:   23: 11.62%: [unknown domain]
 19.343:  3.08%:    2:  1.01%: .dk (Denmark)
 19.198:  3.06%:   12:  6.06%: .net (Networks)
  7.273:  1.16%:    1:  0.51%:   arcor-ip.net
  3.460:  0.55%:    1:  0.51%:   sify.net
  3.171:  0.50%:    1:  0.51%:   verat.net
  4.472:  0.71%:    1:  0.51%: .pt (Portugal)
  3.960:  0.63%:    1:  0.51%: .nl (Netherlands)
  2.023:  0.32%:    4:  2.02%: .jp (Japan)
  1.445:  0.23%:    1:  0.51%: .pe (Peru)
  0.901:  0.14%:    5:  2.53%: .mx (Mexico)
  0.726:  0.12%:    1:  0.51%: .ru (Russia)
  0.429:  0.07%:    2:  1.01%: .ro (Romania)
  0.351:  0.06%:    1:  0.51%: .it (Italy)
  0.093:  0.01%:    1:  0.51%: .pk (Pakistan)
  0.055:  0.01%:    1:  0.51%: .au (Australia)
  0.031:       :    1:  0.51%: .yu (Yugoslavia)
(Go To: Top: General Summary: Monthly Report: Daily Summary: Hourly Summary: Domain Report: Organisation Report: Status Code Report: File Size Report: File Type Report: Directory Report: Request Report)
This report lists the organisations of the computers which requested files.

Listing the top 20 organisations by the number of requests, sorted by the number of requests.
reqs: %bytes: organisation
----: ------: ------------
  32: 12.22%: scanditron.com
  23:  5.73%: [unknown domain]
  10:  2.01%: omakaista.fi
  10:  2.60%: aol.com
   9:  5.37%: netsonic.fi
   9:  6.81%: wanadoo.fr
   6:  0.02%: telia.com
   6:  0.20%: ig.com.br
   5:  5.83%: telesp.net.br
   5:  0.14%: prodigy.net.mx
   4:  5.08%: multi.fi
   4:  5.72%: inet.fi
   4:  6.20%: tpo.fi
   4:  2.52%: bonet.se
   3:  1.85%: surfeu.fi
   3:       : utu.fi
   3:  2.83%: skanova.com
   3:  0.05%: tnc.ne.jp
   2:  0.01%: prtc.net
   2:  0.07%: xnet.ro
  51: 34.73%: [not listed: 45 organisations]
(Go To: Top: General Summary: Monthly Report: Daily Summary: Hourly Summary: Domain Report: Organisation Report: Status Code Report: File Size Report: File Type Report: Directory Report: Request Report)
This report lists the HTTP status codes of all requests.
Listing status codes, sorted numerically.
reqs: status code
----: -----------
 198: 200 OK
(Go To: Top: General Summary: Monthly Report: Daily Summary: Hourly Summary: Domain Report: Organisation Report: Status Code Report: File Size Report: File Type Report: Directory Report: Request Report)
This report lists the sizes of files.

       size: reqs: %bytes:
-----------: ----: ------:
          0:   20:       :
   1b-  10b:    6:       :
  11b- 100b:    0:       :
 101b-  1kb:    0:       :
  1kb- 10kb:    4:       :
 10kb-100kb:   44:  0.38%:
100kb-  1Mb:   48:  2.44%:
  1Mb- 10Mb:   60: 46.56%:
 10Mb-100Mb:   16: 50.62%:
(Go To: Top: General Summary: Monthly Report: Daily Summary: Hourly Summary: Domain Report: Organisation Report: Status Code Report: File Size Report: File Type Report: Directory Report: Request Report)
This report lists the extensions of requested files.

Listing extensions with at least 0.1% of the traffic, sorted by the amount of traffic.
 Mbytes: %bytes: reqs:  %reqs: extension
-------: ------: ----: ------: ---------
542.260: 86.31%:  154: 77.78%: .exe  [Executables]
 54.220:  8.63%:    7:  3.54%: .gz   [Gzip compressed files]
 54.220:  8.63%:    7:  3.54%:   .tar.gz [Compressed archives]
 17.614:  2.80%:    5:  2.53%: .zip  [Zip archives]
 13.803:  2.20%:   18:  9.09%: .xpi
  0.391:  0.06%:   14:  7.07%: [not listed: 5 extensions]
(Go To: Top: General Summary: Monthly Report: Daily Summary: Hourly Summary: Domain Report: Organisation Report: Status Code Report: File Size Report: File Type Report: Directory Report: Request Report)
This report lists the directories from which files were requested. (The figures for each directory include all of its subdirectories.)
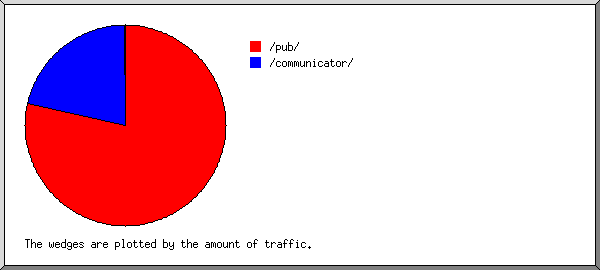
Listing directories with at least 0.01% of the traffic, sorted by the amount of traffic.
 Mbytes: %bytes: reqs:  %reqs: pages: %pages: directory
-------: ------: ----: ------: -----: ------: ---------
580.819: 92.44%:  186: 93.94%:     0:       : /pub/
 47.080:  7.49%:    4:  2.02%:     0:       : /communicator/
  0.384:  0.06%:    1:  0.51%:     0:       : [no directory]
  0.006:       :    7:  3.54%:     0:       : [not listed: 2 directories]
(Go To: Top: General Summary: Monthly Report: Daily Summary: Hourly Summary: Domain Report: Organisation Report: Status Code Report: File Size Report: File Type Report: Directory Report: Request Report)
This report lists the files on the site.
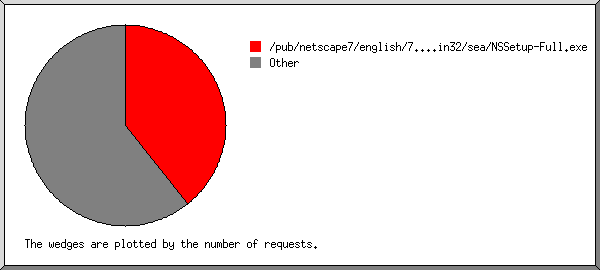
Listing files with at least 20 requests, sorted by the number of requests.
 Mbytes: %bytes: reqs:  %reqs: file
-------: ------: ----: ------: ----
231.804: 36.89%:   50: 25.25%: /pub/netscape7/english/7.1/windows/win32/sea/NSSetup-Full.exe
 73.973: 11.77%:   22: 11.11%: /pub/netscape7/portuguese_br/7.02/windows/win32/sea/NSSetupB.exe
322.512: 51.33%:  126: 63.64%: [not listed: 61 files]
(Go To: Top: General Summary: Monthly Report: Daily Summary: Hourly Summary: Domain Report: Organisation Report: Status Code Report: File Size Report: File Type Report: Directory Report: Request Report)


