 Web Server Statistics for NIC.Funet.fi Web Server Statistics for NIC.Funet.fi
(Go To: Top: General Summary: Monthly Report: Daily Summary: Hourly Summary: Domain Report: Organisation Report: Status Code Report: File Size Report: File Type Report: Directory Report: Request Report)
This report contains overall statistics.
Successful requests: 543
Average successful requests per day: 77
Distinct files requested: 130
Distinct hosts served: 324
Data transferred: 871.417 megabytes
Average data transferred per day: 124.735 megabytes
(Go To: Top: General Summary: Monthly Report: Daily Summary: Hourly Summary: Domain Report: Organisation Report: Status Code Report: File Size Report: File Type Report: Directory Report: Request Report)
This report lists the activity in each month.
Each unit ( ) represents 30 megabytes
or part thereof.
) represents 30 megabytes
or part thereof.
month: Mbytes: %bytes: reqs: %reqs: --------: -------: ------: ----: ------: Jul 2002: 216.216: 24.81%: 166: 30.57%:Busiest month: Aug 2002 (655.200 megabytes).Aug 2002: 655.200: 75.19%: 377: 69.43%:

(Go To: Top: General Summary: Monthly Report: Daily Summary: Hourly Summary: Domain Report: Organisation Report: Status Code Report: File Size Report: File Type Report: Directory Report: Request Report)
This report lists the total activity for each day of the week, summed over all the weeks in the report.
Each unit () represents 10 megabytes
or part thereof.
day: Mbytes: %bytes: reqs: %reqs: ---: -------: ------: ----: ------: Sun: 127.373: 14.62%: 80: 14.73%:
(Go To: Top: General Summary: Monthly Report: Daily Summary: Hourly Summary: Domain Report: Organisation Report: Status Code Report: File Size Report: File Type Report: Directory Report: Request Report)
This report lists the total activity for each hour of the day, summed over all the days in the report.
Each unit () represents 1 request
for a page.
hour:  Mbytes: %bytes: reqs:  %reqs:
----: -------: ------: ----: ------:
   0:   4.394:  0.50%:   25:  4.60%:
   1:   1.277:  0.15%:    8:  1.47%:
   2:  12.950:  1.49%:   22:  4.05%:
   3:  17.183:  1.97%:   26:  4.79%:
   4:  14.611:  1.68%:   10:  1.84%:
   5:   7.272:  0.83%:   10:  1.84%:
   6:  12.440:  1.43%:   26:  4.79%:
   7:   3.111:  0.36%:   31:  5.71%:
   8:  28.008:  3.21%:   26:  4.79%:
   9:   0.968:  0.11%:   14:  2.58%:
  10: 116.561: 13.38%:   50:  9.21%:
  11:  25.838:  2.97%:   15:  2.76%:
  12:  27.828:  3.19%:   26:  4.79%:
  13:  18.364:  2.11%:    8:  1.47%:
  14:  73.684:  8.46%:   36:  6.63%:
  15:  14.153:  1.62%:   31:  5.71%:
  16:  94.919: 10.89%:   23:  4.24%:
  17:  49.893:  5.73%:   25:  4.60%:
  18:  25.296:  2.90%:   26:  4.79%:
  19:  23.177:  2.66%:   26:  4.79%:
  20:  39.212:  4.50%:   23:  4.24%:
  21: 170.246: 19.54%:   19:  3.50%:
  22:  57.731:  6.63%:   24:  4.42%:
  23:  32.290:  3.71%:   13:  2.39%:
(Go To: Top: General Summary: Monthly Report: Daily Summary: Hourly Summary: Domain Report: Organisation Report: Status Code Report: File Size Report: File Type Report: Directory Report: Request Report)
This report lists the countries of the computers which requested files.

Listing domains, sorted by the amount of traffic.
 Mbytes: %bytes: reqs:  %reqs: domain
-------: ------: ----: ------: ------
385.975: 44.29%:   83: 15.29%: .fi (Finland)
115.053: 13.20%:   28:  5.16%:   inet.fi
 62.790:  7.21%:    2:  0.37%:   cygate.fi
 37.462:  4.30%:    5:  0.92%:   hut.fi
 34.423:  3.95%:    6:  1.10%:   affecto.fi
 32.290:  3.71%:   11:  2.03%:   htv.fi
 31.395:  3.60%:    1:  0.18%:   osakk.fi
 25.914:  2.97%:   21:  3.87%:   turkuamk.fi
 22.515:  2.58%:    1:  0.18%:   kase.fi
 12.032:  1.38%:    2:  0.37%:   radiolinja.fi
 11.928:  1.37%:    1:  0.18%:   multi.fi
128.829: 14.78%:   29:  5.34%: .it (Italy)
 78.500:  9.01%:  144: 26.52%: [unknown domain]
 55.159:  6.33%:   50:  9.21%: .net (Networks)
 10.539:  1.21%:    4:  0.74%:   t-dialin.net
  8.769:  1.01%:    1:  0.18%:   techtelnet.net
  8.015:  0.92%:    1:  0.18%:   prserv.net
  6.892:  0.79%:    2:  0.37%:   proxad.net
  6.875:  0.79%:    3:  0.55%:   hinet.net
  6.242:  0.72%:    2:  0.37%:   telus.net
 36.487:  4.19%:   27:  4.97%: .com (Commercial)
 28.580:  3.28%:    3:  0.55%:   telia.com
 32.141:  3.69%:    5:  0.92%: .dk (Denmark)
 29.477:  3.38%:    5:  0.92%: .se (Sweden)
 22.534:  2.59%:    3:  0.55%:   ericsson.se
  6.943:  0.80%:    2:  0.37%:   chello.se
 19.593:  2.25%:    7:  1.29%: .fr (France)
 15.254:  1.75%:   54:  9.94%: .br (Brazil)
 12.472:  1.43%:    5:  0.92%: .hu (Hungary)
 11.976:  1.37%:   11:  2.03%: .pl (Poland)
  9.709:  1.11%:    3:  0.55%: .es (Spain)
  9.056:  1.04%:    4:  0.74%: .at (Austria)
  8.952:  1.03%:   11:  2.03%: .mx (Mexico)
  5.687:  0.65%:    1:  0.18%: .ae (United Arab Emirates)
  5.022:  0.58%:   26:  4.79%: .ca (Canada)
  4.554:  0.52%:    2:  0.37%: .hk (Hong Kong)
  3.304:  0.38%:    1:  0.18%: .jp (Japan)
  3.280:  0.38%:   11:  2.03%: .ar (Argentina)
  3.054:  0.35%:    3:  0.55%: .lt (Lithuania)
  2.164:  0.25%:    9:  1.66%: .ru (Russia)
  2.085:  0.24%:    2:  0.37%: .tw (Taiwan)
  2.024:  0.23%:    7:  1.29%: .ch (Switzerland)
  1.998:  0.23%:    2:  0.37%: .cy (Cyprus)
  1.000:  0.11%:    5:  0.92%: .cl (Chile)
  0.976:  0.11%:    1:  0.18%: .nl (Netherlands)
  0.495:  0.06%:    3:  0.55%: .co (Colombia)
  0.333:  0.04%:    3:  0.55%: .nz (New Zealand)
  0.323:  0.04%:    7:  1.29%: .ie (Ireland)
  0.256:  0.03%:    6:  1.10%: .ro (Romania)
  0.250:  0.03%:    3:  0.55%: .il (Israel)
  0.222:  0.03%:    1:  0.18%: .sa (Saudi Arabia)
  0.156:  0.02%:    1:  0.18%: .pk (Pakistan)
  0.132:  0.02%:    1:  0.18%: .in (India)
  0.095:  0.01%:    2:  0.37%: .sg (Singapore)
  0.085:  0.01%:    1:  0.18%: .cz (Czech Republic)
  0.085:  0.01%:    2:  0.37%: .th (Thailand)
  0.070:  0.01%:    1:  0.18%: .ci (Ivory Coast)
  0.070:  0.01%:    2:  0.37%: .tr (Turkey)
  0.054:  0.01%:    1:  0.18%: .pe (Peru)
  0.043:       :    1:  0.18%: .sk (Slovakia)
(Go To: Top: General Summary: Monthly Report: Daily Summary: Hourly Summary: Domain Report: Organisation Report: Status Code Report: File Size Report: File Type Report: Directory Report: Request Report)
This report lists the organisations of the computers which requested files.

Listing the top 20 organisations by the number of requests, sorted by the number of requests.
reqs: %bytes: organisation
----: ------: ------------
 144:  9.01%: [unknown domain]
  28: 13.20%: inet.fi
  24:       : libero.it
  21:  2.97%: turkuamk.fi
  18:  0.77%: telesp.net.br
  11:       : f-secure.com
  11:  3.71%: htv.fi
  10:  0.08%: sympatico.ca
  10:  0.12%: acessonet.com.br
   9:  0.43%: qc.sympatico.ca
   7:  0.04%: iol.ie
   7:  1.01%: prodigy.net.mx
   6:  2.08%: wanadoo.fr
   6:  3.95%: affecto.fi
   5: 14.78%: net24.it
   5:  1.43%: broadband.hu
   5:  0.05%: telebrasilia.net.br
   5:  0.21%: utk.ru
   5:  4.30%: hut.fi
   5:  0.23%: lublin.mm.pl
 201: 41.63%: [not listed: 125 organisations]
(Go To: Top: General Summary: Monthly Report: Daily Summary: Hourly Summary: Domain Report: Organisation Report: Status Code Report: File Size Report: File Type Report: Directory Report: Request Report)
This report lists the HTTP status codes of all requests.
Listing status codes, sorted numerically.
reqs: status code
----: -----------
 543: 200 OK
(Go To: Top: General Summary: Monthly Report: Daily Summary: Hourly Summary: Domain Report: Organisation Report: Status Code Report: File Size Report: File Type Report: Directory Report: Request Report)
This report lists the sizes of files.

       size: reqs: %bytes:
-----------: ----: ------:
          0:   50:       :
   1b-  10b:    8:       :
  11b- 100b:   13:       :
 101b-  1kb:   44:       :
  1kb- 10kb:   20:  0.01%:
 10kb-100kb:  187:  1.22%:
100kb-  1Mb:  131:  4.16%:
  1Mb- 10Mb:   66: 30.19%:
 10Mb-100Mb:   24: 64.42%:
(Go To: Top: General Summary: Monthly Report: Daily Summary: Hourly Summary: Domain Report: Organisation Report: Status Code Report: File Size Report: File Type Report: Directory Report: Request Report)
This report lists the extensions of requested files.

Listing extensions with at least 0.1% of the traffic, sorted by the amount of traffic.
 Mbytes: %bytes: reqs:  %reqs: extension
-------: ------: ----: ------: ---------
588.578: 67.54%:  436: 80.29%: .exe  [Executables]
192.892: 22.14%:   13:  2.39%: .gz   [Gzip compressed files]
192.892: 22.14%:   12:  2.21%:   .tar.gz [Compressed archives]
 45.673:  5.24%:   15:  2.76%: .xpi
 29.284:  3.36%:    3:  0.55%: .bin
  8.177:  0.94%:    2:  0.37%: .hqx  [Macintosh BinHex files]
  6.306:  0.72%:    5:  0.92%: .zip  [Zip archives]
  0.504:  0.06%:   69: 12.71%: [not listed: 13 extensions]
(Go To: Top: General Summary: Monthly Report: Daily Summary: Hourly Summary: Domain Report: Organisation Report: Status Code Report: File Size Report: File Type Report: Directory Report: Request Report)
This report lists the directories from which files were requested. (The figures for each directory include all of its subdirectories.)
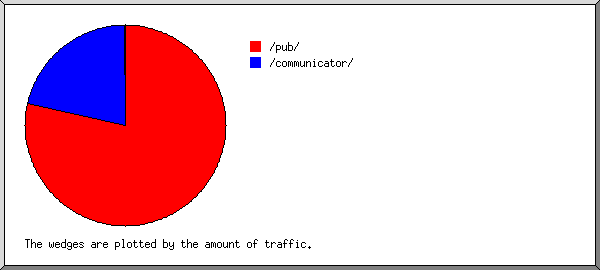
Listing directories with at least 0.01% of the traffic, sorted by the amount of traffic.
 Mbytes: %bytes: reqs:  %reqs: pages: %pages: directory
-------: ------: ----: ------: -----: ------: ---------
814.009: 93.41%:  520: 95.76%:     0:       : /pub/
 56.980:  6.54%:    6:  1.10%:     0:       : /communicator/
  0.384:  0.04%:    2:  0.37%:     0:       : [no directory]
  0.041:       :   15:  2.76%:     0:       : [not listed: 2 directories]
(Go To: Top: General Summary: Monthly Report: Daily Summary: Hourly Summary: Domain Report: Organisation Report: Status Code Report: File Size Report: File Type Report: Directory Report: Request Report)
This report lists the files on the site.
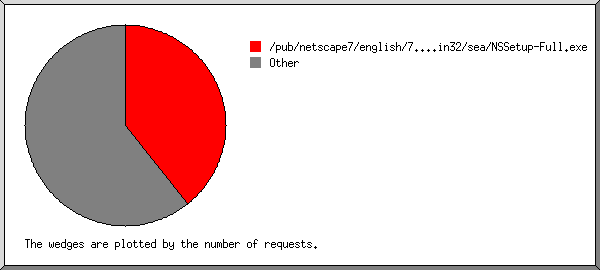
Listing files with at least 20 requests, sorted by the number of requests.
 Mbytes: %bytes: reqs:  %reqs: file
-------: ------: ----: ------: ----
 16.792:  1.93%:  240: 44.20%: /pub/netscape7/english/7.0_PR1/windows/win32/NSSetup.exe
219.991: 25.25%:   34:  6.26%: /pub/netscape7/english/7.0_PR1/windows/win32/sea/NSSetupB.exe
 77.491:  8.89%:   23:  4.24%: /pub/communicator/english/4.79/windows/windows95_or_nt/complete_install/cc32d479.exe
557.141: 63.94%:  246: 45.30%: [not listed: 127 files]
(Go To: Top: General Summary: Monthly Report: Daily Summary: Hourly Summary: Domain Report: Organisation Report: Status Code Report: File Size Report: File Type Report: Directory Report: Request Report)


