 Web Server Statistics for NIC.Funet.fi Web Server Statistics for NIC.Funet.fi
(Go To: Top: General Summary: Monthly Report: Daily Summary: Hourly Summary: Domain Report: Organisation Report: Status Code Report: File Size Report: File Type Report: Directory Report: Request Report)
This report contains overall statistics.
Successful requests: 119
Average successful requests per day: 17
Distinct files requested: 55
Distinct hosts served: 47
Data transferred: 510.422 megabytes
Average data transferred per day: 74.985 megabytes
(Go To: Top: General Summary: Monthly Report: Daily Summary: Hourly Summary: Domain Report: Organisation Report: Status Code Report: File Size Report: File Type Report: Directory Report: Request Report)
This report lists the activity in each month.
Each unit ( ) represents 25 megabytes
or part thereof.
) represents 25 megabytes
or part thereof.
   month:  Mbytes: %bytes: reqs:  %reqs:
--------: -------: ------: ----: ------:
Jul 2003: 510.422:   100%:  119:   100%:
Busiest month: Jul 2003 (510.422 megabytes).
(Go To: Top: General Summary: Monthly Report: Daily Summary: Hourly Summary: Domain Report: Organisation Report: Status Code Report: File Size Report: File Type Report: Directory Report: Request Report)
This report lists the total activity for each day of the week, summed over all the weeks in the report.
Each unit () represents 6 megabytes
or part thereof.
day: Mbytes: %bytes: reqs: %reqs: ---: -------: ------: ----: ------: Sun: 7.301: 1.43%: 6: 5.04%:Mon: 172.590: 33.81%: 35: 29.41%:
Thu: 102.611: 20.10%: 23: 19.33%:
(Go To: Top: General Summary: Monthly Report: Daily Summary: Hourly Summary: Domain Report: Organisation Report: Status Code Report: File Size Report: File Type Report: Directory Report: Request Report)
This report lists the total activity for each hour of the day, summed over all the days in the report.
Each unit () represents 1 request
for a page.
hour:  Mbytes: %bytes: reqs:  %reqs:
----: -------: ------: ----: ------:
   0:   0.777:  0.15%:    1:  0.84%:
   1:   0.000:       :    0:       :
   2:  16.612:  3.25%:    2:  1.68%:
   3:   8.898:  1.74%:    1:  0.84%:
   4:   0.000:       :    0:       :
   5:   0.007:       :    9:  7.56%:
   6:  29.270:  5.73%:    1:  0.84%:
   7:   0.000:       :    0:       :
   8:  29.570:  5.79%:    4:  3.36%:
   9:   5.586:  1.09%:    4:  3.36%:
  10:  43.973:  8.62%:    5:  4.20%:
  11:  32.665:  6.40%:   24: 20.17%:
  12:  29.419:  5.76%:    3:  2.52%:
  13:  61.510: 12.05%:   24: 20.17%:
  14:  33.791:  6.62%:    5:  4.20%:
  15:  90.146: 17.66%:   13: 10.92%:
  16:   6.343:  1.24%:    2:  1.68%:
  17:  45.549:  8.92%:    5:  4.20%:
  18:   0.000:       :    0:       :
  19:  17.657:  3.46%:    4:  3.36%:
  20:   5.354:  1.05%:    1:  0.84%:
  21:   3.634:  0.71%:    2:  1.68%:
  22:  30.628:  6.00%:    4:  3.36%:
  23:  19.023:  3.73%:    5:  4.20%:
(Go To: Top: General Summary: Monthly Report: Daily Summary: Hourly Summary: Domain Report: Organisation Report: Status Code Report: File Size Report: File Type Report: Directory Report: Request Report)
This report lists the countries of the computers which requested files.
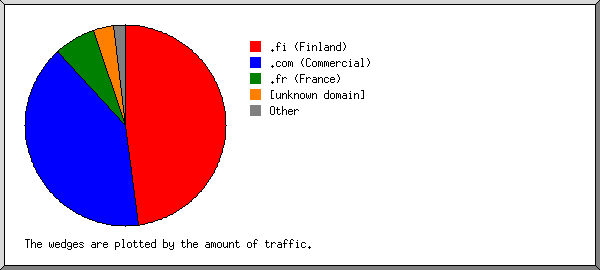
Listing domains, sorted by the amount of traffic.
 Mbytes: %bytes: reqs:  %reqs: domain
-------: ------: ----: ------: ------
227.581: 44.59%:   54: 45.38%: .fi (Finland)
 58.545: 11.47%:   10:  8.40%:   vtt.fi
 31.493:  6.17%:   12: 10.08%:   fmi.fi
 29.407:  5.76%:    4:  3.36%:   kase.fi
 29.279:  5.74%:   14: 11.76%:   proput.fi
 29.270:  5.73%:    1:  0.84%:   occuphealth.fi
 29.270:  5.73%:    1:  0.84%:   verkkotieto.fi
 17.782:  3.48%:    5:  4.20%:   inet.fi
168.283: 32.97%:   15: 12.61%: .net (Networks)
 86.872: 17.02%:    4:  3.36%:   edelkey.net
 46.940:  9.20%:    3:  2.52%:   afeas.net
 22.749:  4.46%:    2:  1.68%:   cafe-seed.net
  6.335:  1.24%:    1:  0.84%:   firstream.net
  5.354:  1.05%:    1:  0.84%:   newcomamericas.net
 40.868:  8.01%:    9:  7.56%: .fr (France)
 29.294:  5.74%:    2:  1.68%: .yu (Yugoslavia)
 11.947:  2.34%:    1:  0.84%: .nl (Netherlands)
 11.058:  2.17%:    5:  4.20%: .com (Commercial)
  5.878:  1.15%:    4:  3.36%:   aol.com
  5.179:  1.01%:    1:  0.84%:   telia.com
  6.306:  1.24%:   10:  8.40%: [unknown domain]
  4.664:  0.91%:    1:  0.84%: .dk (Denmark)
  3.632:  0.71%:    1:  0.84%: .ar (Argentina)
  3.386:  0.66%:    8:  6.72%: .ro (Romania)
  3.171:  0.62%:    7:  5.88%: .de (Germany)
  0.187:  0.04%:    4:  3.36%: .ca (Canada)
  0.039:  0.01%:    2:  1.68%: .tr (Turkey)
(Go To: Top: General Summary: Monthly Report: Daily Summary: Hourly Summary: Domain Report: Organisation Report: Status Code Report: File Size Report: File Type Report: Directory Report: Request Report)
This report lists the organisations of the computers which requested files.

Listing the top 20 organisations by the number of requests, sorted by the number of requests.
reqs: %bytes: organisation
----: ------: ------------
  14:  5.74%: proput.fi
  12:  6.17%: fmi.fi
  10: 11.47%: vtt.fi
  10:  1.24%: [unknown domain]
   8:  0.66%: zappmobile.ro
   7:  0.62%: tiscali.de
   5:  3.48%: inet.fi
   4: 17.02%: edelkey.net
   4:  5.76%: kase.fi
   4:  1.15%: aol.com
   4:  0.04%: mc.videotron.ca
   4:  2.92%: francenet.fr
   3:  0.07%: aac.fi
   3:  9.20%: afeas.net
   2:       : omakaista.fi
   2:  0.01%: proxad.net
   2:       : primus-india.net
   2:  5.74%: telekom.yu
   2:  2.34%: wanadoo.fr
   2:  4.46%: cafe-seed.net
  15: 21.92%: [not listed: 14 organisations]
(Go To: Top: General Summary: Monthly Report: Daily Summary: Hourly Summary: Domain Report: Organisation Report: Status Code Report: File Size Report: File Type Report: Directory Report: Request Report)
This report lists the HTTP status codes of all requests.
Listing status codes, sorted numerically.
reqs: status code
----: -----------
 119: 200 OK
(Go To: Top: General Summary: Monthly Report: Daily Summary: Hourly Summary: Domain Report: Organisation Report: Status Code Report: File Size Report: File Type Report: Directory Report: Request Report)
This report lists the sizes of files.
       size: reqs: %bytes:
-----------: ----: ------:
          0:   10:       :
   1b-  10b:    0:       :
  11b- 100b:    6:       :
 101b-  1kb:   18:       :
  1kb- 10kb:   12:       :
 10kb-100kb:   20:  0.15%:
100kb-  1Mb:   16:  0.77%:
  1Mb- 10Mb:   18: 14.62%:
 10Mb-100Mb:   19: 84.45%:
(Go To: Top: General Summary: Monthly Report: Daily Summary: Hourly Summary: Domain Report: Organisation Report: Status Code Report: File Size Report: File Type Report: Directory Report: Request Report)
This report lists the extensions of requested files.

Listing extensions with at least 0.1% of the traffic, sorted by the amount of traffic.
 Mbytes: %bytes: reqs:  %reqs: extension
-------: ------: ----: ------: ---------
433.154: 84.86%:   59: 49.58%: .exe  [Executables]
 44.301:  8.68%:    8:  6.72%: .xpi
 32.625:  6.39%:    9:  7.56%: .gz   [Gzip compressed files]
 32.599:  6.39%:    8:  6.72%:   .tar.gz [Compressed archives]
  0.341:  0.07%:   43: 36.13%: [not listed: 6 extensions]
(Go To: Top: General Summary: Monthly Report: Daily Summary: Hourly Summary: Domain Report: Organisation Report: Status Code Report: File Size Report: File Type Report: Directory Report: Request Report)
This report lists the directories from which files were requested. (The figures for each directory include all of its subdirectories.)

Listing directories with at least 0.01% of the traffic, sorted by the amount of traffic.
 Mbytes: %bytes: reqs:  %reqs: pages: %pages: directory
-------: ------: ----: ------: -----: ------: ---------
440.386: 86.28%:  101: 84.87%:     0:       : /pub/
 69.687: 13.65%:    4:  3.36%:     0:       : /communicator/
  0.338:  0.07%:    2:  1.68%:     0:       : [no directory]
  0.009:       :   12: 10.08%:     0:       : [not listed: 2 directories]
(Go To: Top: General Summary: Monthly Report: Daily Summary: Hourly Summary: Domain Report: Organisation Report: Status Code Report: File Size Report: File Type Report: Directory Report: Request Report)
This report lists the files on the site.
Listing files with at least 20 requests, sorted by the number of requests.
 Mbytes: %bytes: reqs:  %reqs: file
-------: ------: ----: ------: ----
510.422:   100%:  119:   100%: [not listed: 55 files]
(Go To: Top: General Summary: Monthly Report: Daily Summary: Hourly Summary: Domain Report: Organisation Report: Status Code Report: File Size Report: File Type Report: Directory Report: Request Report)


